Research Article | | Peer-Reviewed

Comparative Analysis of Cross-Validation Techniques: LOOCV, K-folds Cross-Validation, and Repeated K-folds Cross-Validation in Machine Learning Models

Received: 4 September 2024     Accepted: 23 September 2024     Published: 10 October 2024
Views:       Downloads:
Abstract

Effective model evaluation is crucial for robust machine learning, and cross-validation techniques play a significant role. This study compares Repeated k-folds Cross Validation, k-folds Cross Validation, and Leave-One-Out Cross Validation (LOOCV) on imbalanced and balanced datasets across four models: Support Vector Machine (SVM), K-Nearest Neighbors (K-NN), Random Forest (RF), and Bagging, both with and without parameter tuning. On imbalanced data without parameter tuning, Repeated k-folds cross-validation demonstrated strong performance for SVM with a sensitivity of 0.541 and balanced accuracy of 0.764. K-folds Cross Validation showed a higher sensitivity of 0.784 for RF and a balanced accuracy of 0.884. In contrast, LOOCV achieved notable sensitivity for RF and Bagging at 0.787 and 0.784, respectively, but at the cost of lower precision and higher variance, as detailed in Table 1. When parameter tuning was applied to balanced data, the performance metrics improved. Sensitivity for SVM reached 0.893 with LOOCV and balanced accuracy for Bagging increased to 0.895. Stratified k-folds provided enhanced precision and F1-Score for SVM and RF. Notably, processing times varied significantly, with k-folds being the most efficient with SVM taking 21.480 seconds and Repeated k-folds showing higher computational demands where RF took approximately 1986.570 seconds in model processing, as shown in Table 4. This analysis underscores that while k-folds and repeated k-folds are generally efficient, LOOCV and balanced approaches offer enhanced accuracy for specific models but require greater computational resources. The choice of cross-validation technique should thus be tailored to the dataset characteristics and computational constraints to ensure optimal model evaluation.

Published in American Journal of Theoretical and Applied Statistics (Volume 13, Issue 5)
DOI 10.11648/j.ajtas.20241305.13
Page(s) 127-137
Creative Commons

This is an Open Access article, distributed under the terms of the Creative Commons Attribution 4.0 International License (http://creativecommons.org/licenses/by/4.0/), which permits unrestricted use, distribution and reproduction in any medium or format, provided the original work is properly cited.

Copyright

Copyright © The Author(s), 2024. Published by Science Publishing Group

Keywords

Cross-Validation, Balanced Data, Imbalanced Data, Parameter Tuning, Hyperparameter Optimization

1. Introduction
Cross-validation is a technique in machine learning and statistical modeling, primarily used for assessing how the results of a statistical analysis will generalize to an independent data set . This process is fundamental for model validation and selection, ensuring that models perform well on unseen data. The concept of cross-validation dates back to the early 20th century, with initial applications in statistics and experimental design . The formalization and popularization of cross-validation methods, however, occurred in the latter half of the 20th century, paralleling the rise of computational statistics and machine learning. Early works by Lachenbruch and Mickey (1968) on Leave One-Out Cross Validation (LOOCV) and K-folds Cross-Validation laid the foundation for contemporary validation practices . Recent advancements in computational power and the proliferation of large datasets have further driven the evolution of cross-validation techniques . The development of ensemble methods and the integration of cross-validation within automated machine learning (AutoML) frameworks exemplify the ongoing innovations in this field . Among the various cross-validation techniques, LOOCV, k-folds Cross-Validation, and Repeated k-folds Cross-Validation are commonly used methods, each with unique advantages and limitations. Cross-validation techniques are employed to mitigate the problem of overfitting, which occurs when a model is excessively complex and captures the noise along with the underlying data pattern. By partitioning the data into training and testing sets, cross-validation helps in achieving a balance between bias and variance, leading to more robust model performance .
LOOCV can be considered as an example of k-folds Cross-Validation with the specific choice of k equal to the number of observations in the dataset . Here, a single observation is used for validation while the rest of the data forms the training data set. This process is repeated further such that each observation in the whole dataset is used only once for validation. Hence, LOOCV offers nearly unbiased error estimation, but it is time-consuming especially when applied to large datasets, and may trigger high variance as well . K-folds cross-validation, on the other hand, is a technique in which the whole data set is divided into k-folds sets of equal sizes. The model is built from the k−1 folds and validated on the remaining fold. In this process, data is partitioned k number of times with every fold in turn used once for testing. The results are then added to come up with a single estimation which is the index estimation. This method is computationally cheaper and has low variation compared with LOOCV making it fit for use in large datasets . When k-folds cross-validation is done several times with different splits of the data, it is known as repeated k-folds cross-validation. This method gives a better approximation of the performance of the model since all the k-folds cross-validation runs are averaged out hence reducing variance as opposed to running only one k-folds cross-validation . Random sampling is most important when k-folds cross-validation has to be repeated especially when the data set is small and variance reduction is a big concern.
From the discussion above, the selection of the cross-validation technique may affect the performance assessment of a given machine learning model. As much as LOOCV is accurate, and provides nearly unbiased error estimation, its variance as well as computing intensity could be higher. With regard to other types of techniques, k-folds cross-validation, with the usual default choice of k=10, has a comparatively smaller value of both bias and variance; however, slightly unstable as well. The repeated k-folds cross-validation enhances the reliability by providing the average of several results, but at the same time raises the computational cost and time . For this reason, the choice of which method of cross-validation to apply in practice is made based on certain parameters such as the size of the dataset, computational possibilities and time, and other requirements of the modeling problem. The disadvantages and benefits of each approach are essential knowledge to build sound and transferable machine learning applications.
Cross-validation techniques are employed in many study fields, such as bioinformatics, finance, and social sciences. For instance, in the field of bioinformatics, cross-validation is used for assessing the ability to predict models employed in genomics and proteomics . In finance, cross-validation is used in validating the risk models and a few algorithmic trading strategies . The sophistication of and the range of applications for machine learning is the reason why there is a need to choose the right cross-validation methods. With regard to time series analysis, ordinary cross-validation may not be applicable because of the temporal dependencies in the data, necessitating adaptations of techniques such as rolling-origin cross-validation . However, it is important to note that the future of cross-validation is inscribed in the capacity to deal with the difficulties arising from big data as well as high dimensional spaces. Currently, researchers have proposed other techniques such as stratified cross-validation and nested cross-validation in a bid to enhance the reliability of the model’s evaluation. Furthermore, cross-validation in combination with increasing data volume and as part of a Scalable and Distributed Computing Environment is going to become essential for large-scale machine learning tasks . The other interesting line of research is the use of adaptive cross-validations that depend on the data characteristics and modeling needs. Such methods could provide ways for more efficient and effective validation in case validation that may be performed in the frame of real-time as well as online learning .
Cross-validation is still considered to be one of the essential methods for model validation and selection in the machine-learning field . The main objective of this paper is to compare the performance of the machine learning model developed from the three cross-validation techniques; LOOCV, k-folds cross-validation, and repeated k-folds cross-validation, with the focus on coming up with an understanding of how each of these techniques should be used. Thus, machine learning continues to evolve, and the ongoing refinement and innovation of cross-validation methods will be essential for advancing the field and achieving robust and reliable predictive modeling. This paper is therefore based on the following three research objectives.
1) To Evaluate the Performance and Computational Efficiency of Different Cross-Validation Techniques
2) To Analyze the Impact of Cross-Validation Techniques on Model Selection and Generalization
3) To Provide Practical Recommendations for Selecting Appropriate Cross-Validation Methods
2. Methods and Materials
2.1. Research Design
The current study employs a cross-sectional research approach in an attempt to assess and contrast the efficacy and the computational effectiveness of the three cross-validation techniques; LOOCV, k-folds CV, and Repeated k-folds CV. The cross-sectional approach allows for the simultaneous analysis of these methods across different machine learning models and datasets at a single point in time. Thus, the study compared the three models to evaluate the influence of each cross-validation technique on the accuracy of the models. The use of cross-sectional design is informed by the view to compare the performance of techniques in terms of execution time and other performance metrics and to get a direct impression of which methods are superior for specific applications or require less computations, which is helpful for practitioners and researchers in the ML field .
2.2. Data Collection
The dataset used in this study was obtained from an open-access database; Kenya National Data Archive (KeNADA) The database contains data commonly used in machine learning studies for various domains including but not limited to; health care, finance, and social sciences. The dataset used in this study was deemed suitable for the assessment of the cross-validation techniques; with an emphasis on the number of cases, classes’ distribution, and the feature space. For this study, the dataset considered contained predictors of malaria prevalence in Kenya with features labeled as Q1-Q13. Missing values were addressed and feature scales were normalized before model development and comparison. The data was split based on the need for the various cross-validation techniques under analysis to enhance consistency in the evaluation.
2.3. Data Analysis
In this study, the analysis focused on evaluating the performance of four machine learning models—K-Nearest Neighbors (K-NN), Support Vector Machine (SVM), Random Forest, and Tree bagging—using three different cross-validation techniques; Leave-One-Out Cross-Validation (LOOCV), K-folds Cross-Validation, and Repeated K-folds Cross Validation. The four machine-learning algorithms were estimated and evaluated for each of the three cross-validation techniques. As discussed earlier, in the case of LOOCV, each of the data is used once to test the model while the rest of the data (N-1) is used for training, while k-folds Cross-Validation, requires splitting the data into ten different folds, where each fold was used as the testing set, and the remaining folds used as the training set. The Repeated k-folds Cross-Validation, on the other hand, was done taking several iterations of k-folds Cross-Validation using different random partitions of data; thus, providing a more accurate estimation of the performance.
2.3.1. Cross Validation Techniques
1) Leave One-Out Cross Validation
LOOCV approach takes every observation in the data set as the validation set and N-1 as the training set. This is done for the entire sample size (N) .
In this method, assume that we have the dataset D, where;
D=x1,y1, x2,y2,x3,y3,,(xn,yn)(1)
In this approach, xi represents the features and the yi1 represents the corresponding label for the outcome for each observation i. Iterations are done from i to n. Model training is done on the N-1 number of observations and only one observation is used as a validation set, giving the classification error with the mathematical equation 2
LOOCV Error= 1ni=1nL(yi,ŷi)(2)
Where L is the loss function. The common loss function is the Mean Squared Error (MSE) expressed as shown in equation 3.
Lyi,ŷi=(yi,ŷi)2(3)
Graphical representation of LOOCV is shown Figure 1
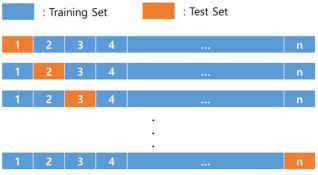
Figure 1. Leave One-Out Cross Validation.
2) K-folds Cross Validation
For the K-folds Cross Validation, assume that we have the dataset given as shown in equation 4
D=x1,y1, x2,y2,x3,y3,,(xn,yn).(4)
Where, xi represents the features and the yi represents the corresponding label for the outcome for each observation i where iterations are done from 1 to n . In this approach, the k-folds CV error is given as shown in equation 5.
K-Fold CV Error= 1ki=1kEi(5)
Where;
Ei=1Dij=1DiL(yij,ŷij)(6)
Graphical representation of the k-folds cross-validation is as shown in Figure 2
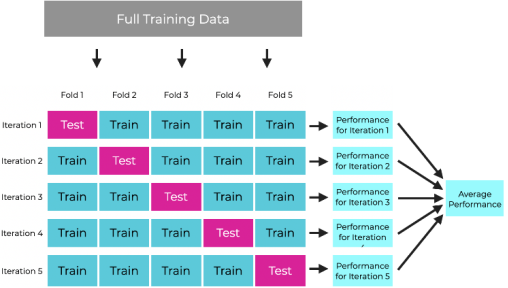
Figure 2. K-folds Cross-Validation.
In the case of five folds cross-validation, the data is split into five folds. In this approach, the model is trained and validated multiple times for various iterations. For every iteration, one-fold is selected as the validation set and the model is trained on the four remaining folds where the performance of the model is evaluated on the newly trained model . In this approach, every fold is used exactly one time for model validation. The average model performance is then calculated from the five iterations.
3) Repeated K-folds Cross Validation
The repeated K-foldss cross-validation is an extension of K-foldss cross-validation . Repeated K-foldss cross-validation provides a way to improve the estimated performance of a machine-learning model. The technique involves simply repeating the cross-validation procedure multiple times and reporting the mean result across all folds from all runs . The results from this technique are expected to be a more accurate estimate of the true unknown underlying mean performance of the model on the dataset, as calculated using the standard error.
2.3.2. Parameter Tuning
Parameter tuning, also referred to as hyperparameter optimization is a crucial step in the machine learning model development process . Hyperparameter optimization helps in the enhancement of the model’s performance on the unseen data . The parameter tuning for the SVM was done by creating a grid search for hyperparameter optimization with the regularization parameter C with values 0.1, 1, 10, and 100. In order to control the spread of the Gaussian function in the RBF kernel sigma parameter was set with values 0.01, 0.1, and 1. Parameter optimization for the k-Nearest Neighbors (k-NN) model was done by setting up the value of k in a sequence of 1 to 21 with an interval of 2. Random forest on the other hand has only one parameter to tune; mtry. This parameter controls the number of features randomly chosen as candidates for splitting a node in each tree. The selection of the optimal mtry was done by selecting a grid search for a sequence of values from 1 to 13 by an interval of 1. The number of trees in the forest was set to 500 to ensure a stable model performance. Lastly, none of the parameters were optimized in the tree bag model since the algorithm focuses on data preprocessing rather than accuracy.
2.4. Machine Learning Models Fitting
1) Support Vector Machines
Two optimization problems in the dual and primal form are solved during the training of the support vector machine . The two forms of the optimization problem are expressed as shown below
Primal form;
12w2+Ci=1nξiw,b,ξmin(7)
Like any other optimization, solving the primal optimization problem is subject to the condition in equation 8
yi(wxi+b)1-ξi,0,i=1,,n(8)
The dual form;
i=1nαi-12i,j=1nαiαjyiyjK(xixjαmax(9)
The solution to the dual optimization problem is subject to the condition in equation 10 below
i=1nαiyi=0, 0αiC, i=1,,n(10)
Upon solving the two optimization problems above, the final model is given as shown below in equation 11
fx= i=1nαiyiK(xi, xj)+b(11)
For the new input feature x (test set), the model predicts the class label (Positive or Negative) using the sign of fx as given in equation 12 .
Predicted Class=signi=1nαiyiKxi, xj+b(12)
2) K-Nearest Neighbors
The k-NN concept and model development is built behind the idea of distance metric known as Euclidean distance Dk and shown in equation 13
dXa, Xb= j=1m(xja- xjb)2(13)
From this approach, neighbors are aggregated and the output is expressed as shown below
ŷ=mode(yi for iNk)(14)
In their paper, propose that the predicted class ŷ for the test instance, 𝑥 is the class that appears most frequently among the 𝑘 selected neighbors:
ŷ=iNkNI(yi=c)cCargmax(15)
3) Random Forest
The random forest is an ensemble approach in machine learning aimed at reducing the overfitting problem and increasing the model’s predictive accuracy .
ŷ= ArgmaxcCb=1BI(TbX=C)(16)
The predicted class of the new instance from the test set is found as shown in equation 17 below
ŷx=modeŷt(x)t=1T(17)
4) Tree Bagging
The tree-bagging algorithm trains the decision tree fb̂ on each bootstrap sample Db. The predicted instance from the test set is shown in equation 18.
Classification: ŷ=model(ŷ1,ŷ2,,ŷB)(18)
2.5. Model Evaluation and Selection
The proposed models were assessed using the following metrics; accuracy, precision, recall, F1 score, and computational time. Thus, these metrics offered an account of how well each model was generalized and the time-saving nature of the cross-validation methods. In order to assess the effects that the different cross-validation techniques invoked on model selection; the consistency of model ranking was also computed. The significance of cross-validation performance metrics was analyzed based on statistical tests along with detailed graphical representations that helped in comparing the efficacy of each of the cross-validation techniques in assessing the performance of K-NN, SVM, Random Forest, and Tree Bagging models.
3. Results and Discussion
3.1. Descriptive Statistics and Features Plot
Table 1. Descriptive Statistics.

N

Mean

SD

Median

Mad

Min

Max

Range

Skew

Kurtosis

SE

Q4

3280.000

0.731

0.444

1.000

0.000

0.000

1.000

1.000

-1.040

-0.918

0.008

Q5

3280.000

1.525

1.004

1.000

0.000

0.000

3.000

3.000

0.407

-1.115

0.018

Q6

3280.000

1.538

1.356

1.000

1.483

0.000

7.000

7.000

0.953

1.228

0.024

Q7

3280.000

0.868

0.826

1.000

1.483

0.000

4.000

4.000

0.690

0.058

0.014

Q8

3280.000

3.179

0.895

3.000

1.483

1.000

4.000

3.000

-0.555

-1.059

0.016

Q9

3280.000

1.314

0.864

1.000

1.483

0.000

3.000

3.000

0.302

-0.526

0.015

Q10

3280.000

0.703

0.780

1.000

0.000

0.000

3.000

3.000

1.412

2.296

0.014

Q11

3280.000

0.099

0.299

0.000

0.000

0.000

1.000

1.000

2.677

5.167

0.005

Q12

3280.000

0.096

0.295

0.000

0.000

0.000

1.000

1.000

2.741

5.514

0.005

Q13

3280.000

0.048

0.215

0.000

0.000

0.000

1.000

1.000

4.203

15.668

0.004

Table 1 above shows descriptive statistics for various predictors of malaria prevalence in Kenya for Q4 to Q13. The descriptive statistics show columns with various measures including but not limited to mean, standard deviation (SD), median, mean absolute deviation, maximum, minimum, range, skewness, kurtosis, and standard error. These statistics show the spread as well as the distribution of the data. On the other hand, Figure 3 below shows how malaria test results varied across different features. The definition of each feature is given in Table 2 below.
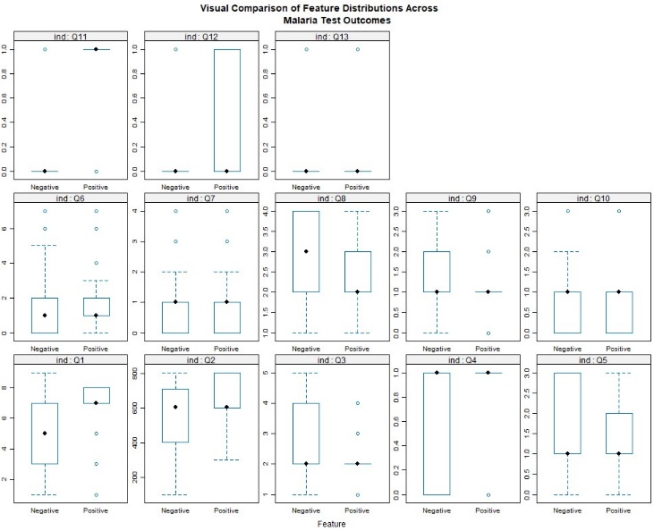
Figure 3. Features Plot for the Distribution of Malaria Tests Outcome.
Table 2. Feature Labels and their Definition.

Feature

Definition

Feature

Definition

Q1

Region

Q8

Anaemic level

Q2

County

Q9

The education level of the mother

Q3

Zones

Q10

Type of mosquito net

Q4

Has Mosquito Net (Yes, No)

Q11

Presence of Falciparum

Q6

Number of Children under five years slept under mosquito nets last night

Q12

Presence of Malariae

Q6

Number of bed nets

Q13

Presence of Ovalle

Q7

Number of children slept under mosquito nets

3.2. Models Estimation and Evaluation
In this study, models were estimated with various cross-validation schemes starting with repeated k-folds cross-validation with 10 folds, followed by k-folds cross-validation with ten folds repeated five times. The final set of models was estimated with leave one out cross-validation (LOOCV). The results in Table 3 below show the performance metrics of the four models on the testing set on the repeated k-folds validation.
Table 3. Model Performance on the Test Set using Imbalanced Data.

Models Performance on the Testing Set

Repeated K-folds Cross Validation

K-folds Cross Validation

Leave One Out Cross Validation

SVM

K-NN

RF

Bagging

SVM

K-NN

RF

Bagging

SVM

K-NN

RF

Bagging

Sensitivity

0.541

0.000

0.784

0.757

0.541

0.054

0.784

0.784

0.541

0.154

0.787

0.784

Specificity

0.987

1.000

0.983

0.979

0.987

1.000

0.983

0.974

0.988

1.000

0.989

0.974

Precision

0.625

NA

0.644

0.583

0.625

1.000

0.644

0.537

0.627

1.000

0.694

0.537

F1-Score

0.580

NA

0.707

0.659

0.580

0.103

0.707

0.637

0.583

0.103

0.777

0.637

Balanced Accuracy

0.764

0.500

0.884

0.868

0.764

0.527

0.884

0.879

0.768

0.524

0.894

0.879

The model performances across different cross-validation techniques revealed notable variations. Sensitivity for K-NN was significantly low, ranging from 0.000 in Repeated K-folds to 0.154 in Leave One Out Cross-Validation (LOOCV), whereas SVM consistently maintained a sensitivity of 0.541 across all techniques. Specificity was uniformly high, with K-NN achieving 1.000 in every scenario. Precision varied slightly, with Bagging showing a lower range (0.537 to 0.583) compared to the more stable SVM and RF models. F1-Scores for K-NN were poor (0.103 in K-folds and LOOCV), while Random Forest demonstrated strong performance across the board, particularly in LOOCV with an F1-Score of 0.777 and a Balanced Accuracy of 0.894. Overall, K-NN showed substantial variability, while Random Forest and Bagging remained more stable across different validation techniques. The results in Figure 4 below show the comparative performance where random forest appeared as the best candidate model in both accuracy and kappa considering the three validation techniques; however, this is without putting into consideration the imbalance nature of the data.
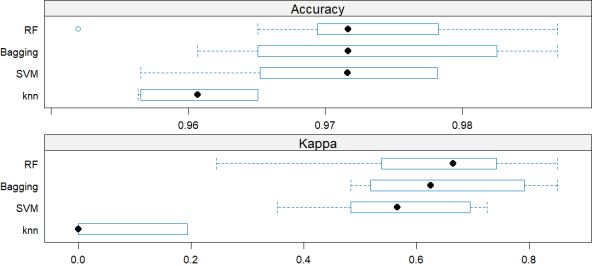
Figure 4. Model Comparison on Average Performance.
3.3. Handling Class Imbalance and Hyperparameter Optimization
Class imbalance is one of the factors affecting the accuracy of the classification models. The results above were derived from imbalanced data which may be misleading. Figure 5 below shows the bar plot for the imbalanced data as well as the balanced data.
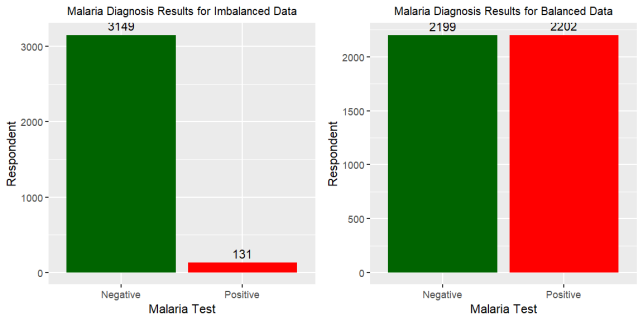
Figure 5. Imbalanced and Balanced Malaria Dataset.
For more accurate and reliable results, the four models Support Vector Machines (SVM), k-NN, Random Forest, and Tree Bagging were re-estimated after applying SMOTE to balance the positive and negative test results. The models’ performance with optimized hyperparameters is tabulated in Table 4.
Table 4. Results from the Balanced Data with Tuned Parameters.

Results from the Balanced Data with Tuned Parameters

Repeated K-folds Cross Validation

K-folds Cross Validation

Leave One Out Cross Validation

SVM

K-NN

RF

Bagging

SVM

K-NN

RF

Bagging

SVM

K-NN

RF

Bagging

Sensitivity

0.784

0.703

0.784

0.784

0.378

0.609

0.811

0.784

0.893

0.740

0.829

0.844

Specificity

0.973

0.979

0.977

0.977

0.981

0.981

0.977

0.973

0.988

0.999

0.993

0.987

Precision

0.527

0.556

0.569

0.569

0.438

0.591

0.577

0.527

0.646

0.598

0.592

0.629

F1-Score

0.630

0.610

0.659

0.659

0.406

0.642

0.674

0.630

0.718

0.669

0.693

0.697

Balanced Accuracy

0.878

0.827

0.880

0.880

0.680

0.842

0.894

0.878

0.897

0.859

0.899

0.895

Processing Time (Seconds)

532.110

21.480

1986.570

1786.570

100.560

5.970

0.884

0.879

987.540

65.652

2509.650

2476.540

After balancing the data and tuning the parameters, the model performances were assessed using Repeated k-folds Cross Validation, k-folds Cross Validation, and Leave One Out Cross Validation (LOOCV). k-NN showed variations, with sensitivity ranging from 0.609 in k-folds to 0.740 in LOOCV. Random Forest (RF) and Bagging models demonstrated consistent sensitivity values around 0.784 to 0.844 across the different methods. Specificity was consistently high across all models and validation techniques, with values close to 0.973 to 0.999. Precision for SVM varied across the methods from 0.438 in k-folds cross-validation, 0.646 in LOOCV, and 0.527 in repeated k-folds cross-validation for the SVM, while k-NN showed slightly higher precision in LOOCV (0.598) compared to other methods. F1-Score varied across models and validation techniques, with SVM showing an F1-Score of 0.630 in repeated k-folds cross-validation, 0.406 in k-folds cross-validation, and 0.718 in LOOCV, while k-NN ranged from 0.610 to 0.669. The Balanced Accuracy metric highlighted that RF and Bagging models performed better, with values up to 0.899 using leave-one-out cross-validation. Processing time significantly differed among the models, with Bagging and Random Forest showing higher computational costs, particularly in LOOCV, where processing times reached up to 2509.650 seconds. The SVM and k-NN models required less computational time, with the k-NN model being the fastest, particularly in k-folds cross-validation, with a processing time of only 5.970 seconds. The results from three validation methods show that the random forest (RF) algorithm was found to perform better. The study established that random forest had reasonably high sensitivity, specificity and almost equal bias for all the validation methods used most especially for the LOOCV which recorded a sensitivity of 0. 829, specificity of 0. 993, and balanced accuracy of 0. 899. Even though the processing time taken for the random forest was high, still the above-explored trade-off seems to be worth it as it has easily outperformed the other models used in this scenario in terms of the performance metrics used to evaluate the model. Using leave-one-out cross-validation (LOOCV) random forest outperformed all the other algorithms in terms of classification of positive and negative cases (Accuracy) as well as in terms of agreement between the actual and predicted positive and negative cases (Kappa). Figure 6 shows how the four models perform in terms of accuracy and kappa.
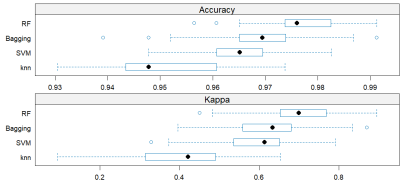
Figure 6. Model's Performance on the Balanced Data with Tuned Parameters.
4. Conclusion
This paper aimed to make a comparative analysis of different cross-validation approaches, LOOCV, k-folds cross-validation, and repeated k-folds cross-validation across several ML algorithms; k-NN, SVM, random forest and tree bagging. The results indicate the strengths and weaknesses of the bias, variance, and computation cost within each method. Although LOOCV gives an estimate of generalization error that is not biased, the method is computationally expensive and possesses high variance especially when applied to large datasets. k-folds cross-validation with k=10 lies in the middle of bias and variance making them ideal for several modeling exercises. k-folds cross-validation is repeated to increase the stability of the cross-validation results by averaging across different folds, however, this increases the computational cost and time. The recommendations derived from the study also pinpoint the need to choose an appropriate cross-validation technique depending on the size of the data set, the computational power available, and the goal of the modeling exercise at hand. In subsequent studies, the emphasis should be placed on the creation of efficient adaptive and progressive approaches to carry out cross-validation with the intent to resolve such dilemmas linked to big data analysis as well as actual-time applications while maintaining the credibility of model assessment given the continually advancing nature of complex machine learning paradigms.
Abbreviations

KeNADA

Kenya National Data Archive

K-NN

K-Nearest Neighbors

LOOCV

Leave One Out Cross -Validation

ML

Machine Learning

RF

Random Forest

SMOTE

Synthetic Minority Over-sampling Technique

SVM

Support Vector Machines

Acknowledgments
We would like to express our sincere gratitude to Prof. Dennis K. Muriithi, for his invaluable guidance and support throughout this research. Our gratitude also goes to the Kenya National Bureau of Statistics (KNBS) for providing recent relevant and accurate data to help address the research objectives.
Author Contributions
Victor Wandera Lumumba: Conceptualization, Data curation, Formal Analysis, Methodology, writing – original draft, Writing – review & editing
Dennis Kiprotich: Conceptualization, Data curation, Formal Analysis, Methodology, writing – original draft, Writing – review & editing
Mary Lemasulani Mpaine: Conceptualization, Data curation, Formal Analysis, Methodology, writing – original draft, Writing – review & editing
Njoka Grace Makena: Conceptualization, Data curation, Formal Analysis, Methodology, writing – original draft, Writing – review & editing
Musyimi Daniel Kavita: Conceptualization, Data curation, Formal Analysis, Methodology, writing – original draft, Writing – review & editing
Funding
The research received no external funding.
Data Availability Statement
The data is available from the corresponding author upon reasonable request.
Conflicts of Interest
The authors declare no conflicts of interest.
References
[1] Wilimitis, D., & Walsh, C. G. (2023). Practical Considerations and Applied Examples of Cross-Validation for Model Development and Evaluation in Health Care: Tutorial. JMIR AI, 2(1), e49023.
[2] Browne, M. W. (2000). Cross-Validation Methods. Journal of Mathematical Psychology, 44(1), 108–132.
[3] Stone, M. (1974). Cross-Validatory Choice and Assessment of Statistical Predictions. Journal of the Royal Statistical Society: Series B (Methodological), 36(2), 111–133.
[4] Lachenbruch, P. A., & Mickey, M. R. (1968). Estimation of Error Rates in Discriminant Analysis. Technometrics, 10(1), 1–11.
[5] Bishnu, S. K., Alnouri, S. Y., & Mohannadi, A. (2023). Computational applications using data-driven modeling in process Systems: A review. Digital Chemical Engineering, 8, 100111–100111.
[6] Feurer, M., Klein, A., Eggensperger, K., Springenberg, J. T., Blum, M., & Hutter, F. (2019). Auto-sklearn: Efficient and Robust Automated Machine Learning. Automated Machine Learning, 113–134.
[7] Hastie, T., Tibshirani, R., & Friedman, J. (2009). The Elements of Statistical Learning. In Springer Series in Statistics. Springer New York.
[8] Berrar, D. (2019). Cross-Validation. Encyclopedia of Bioinformatics and Computational Biology, 1, 542–545.
[9] Wani, F. J., Rizvi, S. E. H., Sharma, M. K., & Bhat, M. I. J. (2018). A study on cross validation for model selection and estimation. INTERNATIONAL JOURNAL of AGRICULTURAL SCIENCES, 14(1), 165–172.
[10] James, G., Witten, D., Hastie, T., & Tibshirani, R. (2021). An Introduction to Statistical Learning. In Springer Texts in Statistics. Springer US.
[11] Kuhn, M., & Johnson, K. (2013). Applied Predictive Modeling. Springer New York.
[12] Schaffer, C. (1993). Selecting a Classification Method by Cross-Validation. Machine Learning, 13(1), 135–143.
[13] Leigh, W., Hightower, R., & Modani, N. (2005). Forecasting the New York stock exchange composite index with past price and interest rate on condition of volume spike. Expert Systems with Applications, 28(1), 1–8.
[14] Bergmeir, C., & Benítez, J. M. (2012). On the use of cross-validation for time series predictor evaluation. Information Sciences, 191, 192–213.
[15] Andoni, A., Naor, A., Nikolov, A., Ilya Razenshteyn, & Waingarten, E. (2018). Data-dependent hashing via nonlinear spectral gaps.
[16] Sugiyama, M., & Kawanabe, M. (2012). Machine learning in non-stationary environments : introduction to covariate shift adaptation. Mit Press.
[17] Yates, L. A., Aandahl, Z., Richards, S. A., & Brook, B. W. (2022). Cross-validation for model selection: a review with examples from ecology. Ecological Monographs, 93(1).
[18] Setia, M. S. (2019). Methodology series module 3: Cross-sectional studies. Indian Journal of Dermatology, 61(3), 261–264. NCBI.
[19] Shao, Z., & Er, M. J. (2016). Efficient Leave-One-Out Cross-Validation-based Regularized Extreme Learning Machine. Neurocomputing, 194, 260–270.
[20] Cha, G.-W., Moon, H. J., Kim, Y.-M., Hong, W.-H., Hwang, J.-H., Park, W.-J., & Kim, Y.-C. (2020). Development of a Prediction Model for Demolition Waste Generation Using a Random Forest Algorithm Based on Small DataSets. International Journal of Environmental Research and Public Health, 17(19), 6997.
[21] Jung, Y., & Hu, J. (2015). AK-foldss averaging cross-validation procedure. Journal of Nonparametric Statistics, 27(2), 167–179.
[22] Ebner, J. (2023, December 27). Cross Validation, Explained - Sharp Sight. Sharp Sight.
[23] Jung, Y. (2017). Multiple predictingK-foldss cross-validation for model selection. Journal of Nonparametric Statistics, 30(1), 197–215.
[24] Yadav, S., & Shukla, S. (2016). Analysis of K-foldss Cross-Validation over Hold-Out Validation on Colossal Datasets for Quality Classification. 2016 IEEE 6th International Conference on Advanced Computing (IACC), 78–83.
[25] Yang, L., & Shami, A. (2020). On hyperparameter optimization of machine learning algorithms: Theory and practice. Neurocomputing, 415, 295–316.
[26] Wu, J., Chen, X.-Y., Zhang, H., Xiong, L.-D., Lei, H., & Deng, S.-H. (2019). Hyperparameter Optimization for Machine Learning Models Based on Bayesian Optimization. Journal of Electronic Science and Technology, 17(1), 26–40.
[27] Muriithi, D., Lumumba, V., & Okongo, M. (2024). A Machine Learning-Based Prediction of Malaria Occurrence in Kenya. American Journal of Theoretical and Applied Statistics, 13(4), 65–72.
[28] Chapelle, O. (2007). Training a Support Vector Machine in the Primal. Neural Computation, 19(5), 1155–1178.
Cite This Article
  • APA Style

    Lumumba, V. W., Kiprotich, D., Mpaine, M. L., Makena, N. G., Kavita, M. D. (2024). Comparative Analysis of Cross-Validation Techniques: LOOCV, K-folds Cross-Validation, and Repeated K-folds Cross-Validation in Machine Learning Models. American Journal of Theoretical and Applied Statistics, 13(5), 127-137. https://doi.org/10.11648/j.ajtas.20241305.13

    Copy | Download

    ACS Style

    Lumumba, V. W.; Kiprotich, D.; Mpaine, M. L.; Makena, N. G.; Kavita, M. D. Comparative Analysis of Cross-Validation Techniques: LOOCV, K-folds Cross-Validation, and Repeated K-folds Cross-Validation in Machine Learning Models. Am. J. Theor. Appl. Stat. 2024, 13(5), 127-137. doi: 10.11648/j.ajtas.20241305.13

    Copy | Download

    AMA Style

    Lumumba VW, Kiprotich D, Mpaine ML, Makena NG, Kavita MD. Comparative Analysis of Cross-Validation Techniques: LOOCV, K-folds Cross-Validation, and Repeated K-folds Cross-Validation in Machine Learning Models. Am J Theor Appl Stat. 2024;13(5):127-137. doi: 10.11648/j.ajtas.20241305.13

    Copy | Download

  • @article{10.11648/j.ajtas.20241305.13,
      author = {Victor Wandera Lumumba and Dennis Kiprotich and Mary Lemasulani Mpaine and Njoka Grace Makena and Musyimi Daniel Kavita},
      title = {Comparative Analysis of Cross-Validation Techniques: LOOCV, K-folds Cross-Validation, and Repeated K-folds Cross-Validation in Machine Learning Models
    },
      journal = {American Journal of Theoretical and Applied Statistics},
      volume = {13},
      number = {5},
      pages = {127-137},
      doi = {10.11648/j.ajtas.20241305.13},
      url = {https://doi.org/10.11648/j.ajtas.20241305.13},
      eprint = {https://article.sciencepublishinggroup.com/pdf/10.11648.j.ajtas.20241305.13},
      abstract = {Effective model evaluation is crucial for robust machine learning, and cross-validation techniques play a significant role. This study compares Repeated k-folds Cross Validation, k-folds Cross Validation, and Leave-One-Out Cross Validation (LOOCV) on imbalanced and balanced datasets across four models: Support Vector Machine (SVM), K-Nearest Neighbors (K-NN), Random Forest (RF), and Bagging, both with and without parameter tuning. On imbalanced data without parameter tuning, Repeated k-folds cross-validation demonstrated strong performance for SVM with a sensitivity of 0.541 and balanced accuracy of 0.764. K-folds Cross Validation showed a higher sensitivity of 0.784 for RF and a balanced accuracy of 0.884. In contrast, LOOCV achieved notable sensitivity for RF and Bagging at 0.787 and 0.784, respectively, but at the cost of lower precision and higher variance, as detailed in Table 1. When parameter tuning was applied to balanced data, the performance metrics improved. Sensitivity for SVM reached 0.893 with LOOCV and balanced accuracy for Bagging increased to 0.895. Stratified k-folds provided enhanced precision and F1-Score for SVM and RF. Notably, processing times varied significantly, with k-folds being the most efficient with SVM taking 21.480 seconds and Repeated k-folds showing higher computational demands where RF took approximately 1986.570 seconds in model processing, as shown in Table 4. This analysis underscores that while k-folds and repeated k-folds are generally efficient, LOOCV and balanced approaches offer enhanced accuracy for specific models but require greater computational resources. The choice of cross-validation technique should thus be tailored to the dataset characteristics and computational constraints to ensure optimal model evaluation.
    },
     year = {2024}
    }
    

    Copy | Download

  • TY  - JOUR
    T1  - Comparative Analysis of Cross-Validation Techniques: LOOCV, K-folds Cross-Validation, and Repeated K-folds Cross-Validation in Machine Learning Models
    
    AU  - Victor Wandera Lumumba
    AU  - Dennis Kiprotich
    AU  - Mary Lemasulani Mpaine
    AU  - Njoka Grace Makena
    AU  - Musyimi Daniel Kavita
    Y1  - 2024/10/10
    PY  - 2024
    N1  - https://doi.org/10.11648/j.ajtas.20241305.13
    DO  - 10.11648/j.ajtas.20241305.13
    T2  - American Journal of Theoretical and Applied Statistics
    JF  - American Journal of Theoretical and Applied Statistics
    JO  - American Journal of Theoretical and Applied Statistics
    SP  - 127
    EP  - 137
    PB  - Science Publishing Group
    SN  - 2326-9006
    UR  - https://doi.org/10.11648/j.ajtas.20241305.13
    AB  - Effective model evaluation is crucial for robust machine learning, and cross-validation techniques play a significant role. This study compares Repeated k-folds Cross Validation, k-folds Cross Validation, and Leave-One-Out Cross Validation (LOOCV) on imbalanced and balanced datasets across four models: Support Vector Machine (SVM), K-Nearest Neighbors (K-NN), Random Forest (RF), and Bagging, both with and without parameter tuning. On imbalanced data without parameter tuning, Repeated k-folds cross-validation demonstrated strong performance for SVM with a sensitivity of 0.541 and balanced accuracy of 0.764. K-folds Cross Validation showed a higher sensitivity of 0.784 for RF and a balanced accuracy of 0.884. In contrast, LOOCV achieved notable sensitivity for RF and Bagging at 0.787 and 0.784, respectively, but at the cost of lower precision and higher variance, as detailed in Table 1. When parameter tuning was applied to balanced data, the performance metrics improved. Sensitivity for SVM reached 0.893 with LOOCV and balanced accuracy for Bagging increased to 0.895. Stratified k-folds provided enhanced precision and F1-Score for SVM and RF. Notably, processing times varied significantly, with k-folds being the most efficient with SVM taking 21.480 seconds and Repeated k-folds showing higher computational demands where RF took approximately 1986.570 seconds in model processing, as shown in Table 4. This analysis underscores that while k-folds and repeated k-folds are generally efficient, LOOCV and balanced approaches offer enhanced accuracy for specific models but require greater computational resources. The choice of cross-validation technique should thus be tailored to the dataset characteristics and computational constraints to ensure optimal model evaluation.
    
    VL  - 13
    IS  - 5
    ER  - 

    Copy | Download

Author Information