Research Article | | Peer-Reviewed

Non-Parametric Fuzzy Regression Discontinuity Design in Modelling Viral Load Suppression Among People Living With HIV/AIDS (PLWHA)

Received: 12 August 2024     Accepted: 10 September 2024     Published: 10 October 2024
Views:       Downloads:
Abstract

Adherence to antiretroviral therapy (ART) is a significant determinant of viral load suppression in HIV patients. There are inadequate statistical models that bring out the direct effects of ART on the suppression of HIV/AIDS. Traditional regression models address the general determinants of viral load suppression. Regression discontinuity designs, on the other hand, bring out the causal effects of ART on viral load suppression based on various thresholds. This study used the non-parametric fuzzy regression discontinuity design (FRDD) to model viral load suppression in PLWHA. The study began with developing a non-parametric FRDD, simulating the model to assess its performance, and applying the model to the Quality-of-Care dataset from Kaggle. The study focused on viral load suppression as the outcome variable, CD4 count and age as the running variables, gender, and whether a patient received counseling as additional covariates. The optimal thresholds were 40.5 years and 320 cubic millimeters for the CD4. There was an increasing negative treatment effect of ART on viral load suppression as the cutoff points for CD4 count increase. At the same time, there was an increasing negative treatment effect of ART on viral load suppression with increasing age. The compliance ratios for respondents increased with the negative increase in the treatment effect. Other analyses, such as the McCrary density test, bunching test, and manipulation test, indicated that the non-parametric fuzzy regression discontinuity design is effective in modeling viral load suppression.

Published in American Journal of Theoretical and Applied Statistics (Volume 13, Issue 5)
DOI 10.11648/j.ajtas.20241305.12
Page(s) 115-126
Creative Commons

This is an Open Access article, distributed under the terms of the Creative Commons Attribution 4.0 International License (http://creativecommons.org/licenses/by/4.0/), which permits unrestricted use, distribution and reproduction in any medium or format, provided the original work is properly cited.

Copyright

Copyright © The Author(s), 2024. Published by Science Publishing Group

Keywords

CD4, Compliance rate, Fuzzy Regression Discontinuity Design, Mccary Test, Viral Load Suppression

1. Introduction
Fuzzy regression discontinuity design (FRDD) is a statistical method that has emerged as a valuable approach for handling quasi-experimental evaluations in causal inferences . It estimates the causal effect of a treatment or intervention on an outcome variable of interest. Fuzzy RDD applies when there is (1) an imperfect implementation that treated some non-eligible people and failed to treat the eligible ones, (2) imperfect compliance with the program, and (3) the assumption that, in the absence of an assignment rule, some people taking the treatment could not have participated in the program . In the context of HIV therapy, fuzzy RDD could be used to evaluate the impact of a particular treatment, such as antiretroviral therapy (ART), on viral load suppression . Although ART is a standard treatment for PLWHA, the precise timing of treatment initiation is often unclear due to diagnostic delays or other factors . This imprecise treatment assignment can also be handled using fuzzy RDD, which defines a fuzzy treatment variable based on the distance of an individual's baseline viral load from a threshold value.
Among the main determinants of viral load suppression is adherence to daily treatments, especially antiretroviral therapy (ART). Although the direct effects of ART on the suppression of HIV/AIDS are known, there lacks statistical models that could bring out the effects of ART on viral load progression across thresholds that separate treatment and control groups when administering HIV medication. Traditional regression analysis techniques focus on the general effects of the determinants of viral load suppression. Since ART initiation is associated with an imprecise treatment assignment, regression discontinuity designs efficiently bring out the causal effects of ART on viral load suppression based on such thresholds. This study uses a non-parametric estimation of the fuzzy regression discontinuity design to determine the causal effects of ART on viral load suppression across different age and CD4 count thresholds. The findings from the study will be efficient in the management of HIV/AIDS. This study applied the non-parametric Fuzzy Regression Discontinuity Design in modelling viral load suppression among PLWHA.
RDD models have been explored since the late 1990s, but less is known about their applicability in clinical research. Their relevance in epidemiological researches fits in due to the ability to assess treatment in the absence of randomized trials. RDD models evaluate the causal inferences of exposures and interventions. Treatment relies on a continuous variable crossing a homogeneous cut-off around which the just treated and just untreated are homogeneous . The two approaches of building fuzzy regression models are through models aiming to create fuzzy relationships, and through models that use actual fuzzy variables . A quasi-experimental regression discontinuity design was used to assess a treat-all policy for initiating ART within a month of enrolling in HIV care. The model indicated the use of FRDD in reflecting probabilistic distribution of ART eligibility .
Implementing a Fuzzy regression discontinuity design would help in reflecting the probabilistic distribution of ART eligibility in the pre-treat-all sample. Early initiation into the ART programs decreases viral load and reduces HIV-based risks of deaths . The use of Monte Carlo simulation has been explored in FRDD studies such as . From these studies, viral load and CD4 count follow a log-normal distribution. Some of the approaches used in accessing the credibility of the model include checking the data for evidence of manipulated treatment variable, graphical analysis, bandwidth selection and sensitivity analysis. The estimation of treatment effect estimates in regression discontinuity (RD) designs is sensitive to the polynomial order and choice of bandwidth . Monte Carlo simulations often indicate a well performing regression kink designs and fuzzy regression discontinuity models for large samples.
2. Materials and Methods
2.1. Description of the Dataset
The study used secondary data, Quality of Care, from Kaggle. The dataset contains information about HIV patients and their treatment development over the years. The original dataset has 46 columns and 27288 rows of data. The cleaning process began with selecting the columns that were relevant for the current analysis and deleting the rows that had missing data. 5597 rows of data were used in the analysis.
2.2. Variables Used in the Study
2.2.1. The Model Variables
The model covariates were gender, ART treatment, age, and CD4 count, while the dependent variable was viral load. Gender was a binary variable with the respondents being either male or female. For the dataset used in the study, age ranged from 1 to 86 years (M=36.34, SD= 12.27).
2.2.2. The Dependent Variable
Viral load was used as the dependent variable. It ranged from 0 to 9928 (M=329, SD=1166.43). In this case, the variable yielded two possible outcomes for each data point.
1. Y(1) described the treatment outcome for a patient who received counselling and
2. Y(0) described the treatment outcome for a patient that did not receive counselling.
2.2.3. The Running Variables
1. The first running variable was age. It was expected that age would affect viral load suppression among PLWHA since it creates a discontinuous relationship with the viral load suppression at various thresholds (c1) which will vary based on the different definitions of youths as shown in appendix 1.
2. The second running variable in the study was the CD4 count at the beginning of the data collection period. In this case, the CD4 count will be data driven, and the threshold c2 will be varied based on the dataset.
2.2.4. Threshold Point C
There were two threshold points occurring in the study, c1,c2,  for each of the running variables age, and CD4 counts. These thresholds for the CD4 count and age were data driven. The threshold points for age were 15, 19, 24, 32, and 35 years based on the pre-existing definitions on the meaning of youths, while the threshold points were 250, 300, 320, 400, 450, and 500 cells/cubic ml for the CD4 counts as replicated from .
2.2.5. Treatment D
This variable measured whether a HIV+ patient received counselling and booster sessions. This was denoted by 1 for the patients who received counselling and O for the patients who did not receive counselling.
Assuming that Di denotes the treatment effect, c denotes the cutoff point, and Xi denotes the continuous score variable, the treatment effect could be expressed as
Di=1xi>cDi=Di=1     if Xi>CDi=0     if Xi<C(1)
An instrument for Di can be created for the points close to the cutoff since the cutoff for FRDD creates a discontinuity in the likelihood of receiving the treatment (does not perfectly determine treatment) such that
Zi=1     if Xic0     if Xic(2)
The LATE parameter estimating the treatment effects for compliers would be expressed as
limc-ϵXc+ϵ, ϵ0(EYZ=1-EYZ=0EDZ=1-EDZ=0)(3)
2.3. Simulation of the RDD Model
The following steps were used in the simulation of the fuzzy regression discontinuity design.
1. Specify the true data generating process. The analysis began by specifying the relationship between the treatment variable (HIV Therapy) and the outcome variable (Viral Load). The researchers identified the distributional properties of the variables in the model. In this case, viral load and CD4 counts were assumed to have a log-normal distribution while age was assumed to be normally distributed. The analysis used multivariate dataset opposed to who used a univariate study.
2. Generate random data sets: Random data sets were generated based on the distributional assumptions specified in step 1. The number of data sets to generate was set to 5000 to be close to the number of data rows in the actual dataset.
3. Estimate the treatment effect: The treatment effect was estimated using fuzzy RDD, which involved fitting a regression model that included both fuzzy treatment assignment and a set of covariates. The effect of the treatment on the outcome was estimated using a discontinuity in the regression function at the threshold value. The LATE was estimated at cut off points c1=15, 19, 24, 32, and 35 years for age and c2=250, 300, 320, 400, 450, and 500 cells/cubic ml for the CD4 counts.
4. Performance assessment was performed using the following steps.
(1) Checking for the evidence of manipulation of age and CD4 counts around the cutoff points using the McCray test.
(2) Graphical analysis of the causal effects estimated by the discontinuities.
(3) Bandwidth selection based on sample size and data driven parameters for each c.
2.4. Fuzzy Regression Discontinuity Model
2.4.1. Assumptions of Fuzzy RDD
1. There is a sample restriction such that the observations of interest are those close to discontinuity where E[Y|D,X] jumps so that xc
Hence
EXZ=1-EXZ=00(4)
2. The threshold creates discontinuity in probability of treatment exposure.
3. There is a discontinuous change in the incentives to participate in ART. The discontinuities produce instrumental variable estimators of the effect of treatment.
4. The threshold is set by a third party which implies that there is an independence of guidelines.
5. The threshold C is a local continuity such that the potential outcomes (0) and (1) are conditional on the forcing variable X.
6. There is monotonicity such that when a person crosses the threshold, their treatment must either remain the same or alter in the same direction.
2.4.2. Membership Function
The local polynomial point estimation was obtained using observations from c-h to c+h, for h0= the bandwidth and c= the cutoff point. The weights used in the analysis were obtained using the kernel function (K.) The steps used in the non-parametric estimation were as follows:
Let f(X) map x to y where x=x1,x2..xpTis the input variable and Y is a fuzzy number. We have
Y=fX+ε(5)
For ε is the observational error, that is a hybrid error with fuzzy and random errors.
The L-R type fuzzy numbers were obtained using the formula
μYz=Ly-zeR    for zy, eL0R z-yeR   for zy, eR0(6)
L and R represented the left and right reference functions of the membership function Y=y,eL,eRLR, y=the mode or the center, and eL,eR are the left and right spreads. The functions L and R differ based on the type of membership function. For the triangular ones, these functions are defined as:
μYz=1-y-zeL    for  eLy-z01-z-yeR   for  eRz-y00,                Otherwise(7)
The study assumed a symmetric triangular fuzzy number. This implied that eL=eR=e, and that the symmetric triangular fuzzy number that was generated was Y=y,e. As such, equation 5 was reduced to
Y=A0+A1x1+A2x2+A3x3(8)
with A0.A3being fuzzy parameters.
The Kernel Smoothing Technique
The local averaging technique was used to approximate the function of the regression values at Xo and for the observations within its neighborhood.
Given that Xi, i=1,2…N, the smoothing function was denoted as
Sx=Xi=AVEi-kji+k(Zj)(9)
For AVE being the median, mean or any weighted average, Xj is a real number and Zj is the observation, and S(x) is the smoother or an estimator of the true function of f(X).
Replacing the fuzzy observations Zjs by their respective fuzzy numbers Yjs would result in the fuzzy local averaging operator expressed as
Sx=Xi=AVÊi-kji+kYj
=AVEi-kji+kyj, AVEi-kji+kej(10)
The weights in this case were represented by a kernel density function. The function contains a scale parameter that adjusts the form and size of weights based on the location of the point with respect to point x.
The kernel estimate S(x) is determined by bandwidth h and the Kernel function K and serves as the weighted average of the response variable in a fixed neighborhood around x.
The smoother is defined as
Yî=Sx=Xi=j=1NwjxYj(11)
For Yî is the estimate of Y_i and w_j(x), j=1, N is the weight sequence defined through j’s.
The weight sequence generated through the kernel estimation was generated using the expression
wjx=Kh(x-Xj)ph(x)(12)
For
phx=j=1NKhx-Xj
And for Khu=1hK(uh) being the kernel with scale factor h.
The scale factor h defines the bandwidth.
2.4.3. Polynomial Selection
A polynomial of order p and Kernel function K (.) was selected for the analysis. A polynomial of degree 3 would offer the most superior results since it would capture more accurate non-linear associations between the study variables, high flexibility in data fitting which would result in a better fit, and a better prediction ability . The analysis entailed the first and second order polynomials to confirm the assertion.
2.4.4. Bandwidth Selection
The ‘rdd’ package in the r software was used for the analysis, and selected the bandwidth based on the study parameters being analyzed and the sample size. Bandwidth selection was essential in ensuring that adequate data points were obtained on each side of the cutoff points and with a reduced regression error when determining the treatment effect using the information close to the cutoffs.
2.4.5. Observations Above the Cutoff
These observations, denoted by xic were modelled by fitting a weighted least squares regression of Yi on a constant and (xi-c), xi-c2, xi-c3 and a weight w=kxi-ch for each observation.
The estimated intercept would be obtained as
μ+̂=μ+=EYi1xi=cYi=μ+̂+μ+,1̂xi-c+μ+,2̂xi-c2+μ+,3̂xi-c3(13)
2.4.6. Observations Below the Cutoff
These observations, denoted by xi<c were modelled by fitting a weighted least squares regression of Yi on a constant and (xi-c), xi-c2, xi-c3 and a weight w=kxi-ch for each observation.
The estimated intercept would be obtained as
μ-̂=μ-=EYi0xi=cYi=μ-̂+μ-,1̂xi-c+(μ_(-,2) ) ̂(x_i-c)^2+(μ_(-,3) ) ̂(x_i-c)^3 (14)
2.4.7. The Fuzzy RD Point Estimate
The canonical equation for the non-parametric fuzzy regression discontinuity model is
τFRD̂=μ+̂-μ-̂=limxc EYX=x-limxc EYX=xlimxc EWX=x-limxc EWX=x=E[Yi1-Yi(0)|unit i is a complier and Xi=c(15)
The equation above is the canonical form of the LATE parameter described in equation 3.
3. Results
3.1. Graphical Representation of the Selected Variable
As mentioned in the methodology, age followed a normal distribution while CD4 count and viral load followed a lognormal distribution. Whether a patient received ART treatment was a binomial variable. These variables in the Quality-of-Care dataset followed an identical distribution. Figure 1 shows the graphical representation of age, CD4 count, and viral load from the Quality-of-Care dataset.
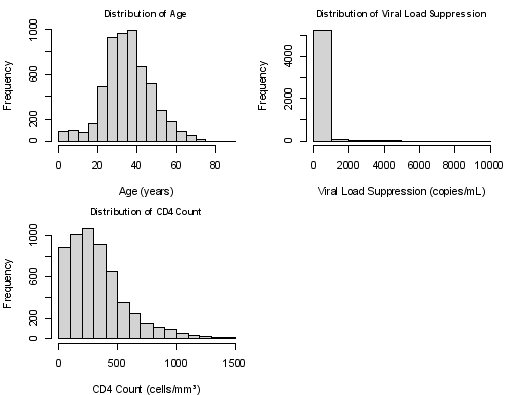
Figure 1. Graphical Representation of the Distributions of the Continuous Variables Used in the Study (Age, CD4 Count, and Viral Load) from the Quality-of-Care Dataset.
3.2. Compliance Around the Cutoff Points
The analysis began with checking for compliance around the cutoff points. The first step in this was to conduct multiple graphical tests that indicated that the optimal cut off point for age was 40.5 years while that for cd4 count was 320. There was an imperfect compliance at the cutoff points for both running variables. A fuzzy regression discontinuity existed some patients below the cutoff point received treatment and some above the cutoff point did not receive treatment. For the Quality-of-Care dataset, there was a fuzzy behavior of the viral load suppression for patients who adhered to the counselling sessions and those that did not across the cutoff points of 40.5 years for age and 320 cells per mm3 for the CD4 count.
3.3. Balance Checks
This test checked for discontinuities in the covariates at their optimal cutoff points. The model covariates were age, gender, and whether or not the patients received ART treatment. These covariates were balanced at each side of the cutoff for both age and CD4 count cutoffs. Inclusion or exclusion of these covariates would have no significant impacts on the causal effect of treatment on viral load suppression. The behavior was identical for the simulated and the Quality-of-Care dataset.
3.4. Manipulation of Bunching Test
This test checked whether the distribution of the forcing variable had a discontinuity. The McCary test was used in this case and tested for all the cutoff points for age and CD4 count. The test indicated that there was no manipulation and no discontinuity in the CD4 count at a cutoff of 320 (The left sided image). At the same time, the study indicated a little jump in the age at a cutoff of 40.5 years (The right-hand image). The respective McCary values associated with the two images below were 0.388 and <0.001 for CD4 count and age, respectively. The overlapping confidence intervals in the manipulation graphs implied no significant difference in the two manipulation lines in the plot. As such, there was no evidence of bunching around the running variables.
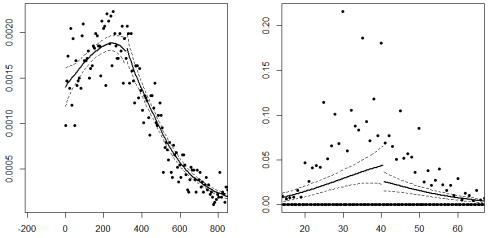
Figure 2. The McCary Density Plot for Discontinuities in CD4 count (RHS) and Age (LHS) for simulated dataset.
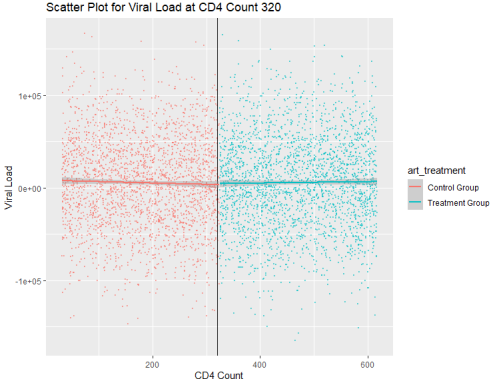
Figure 3. Manipulation Test Graph for CD4 Count.
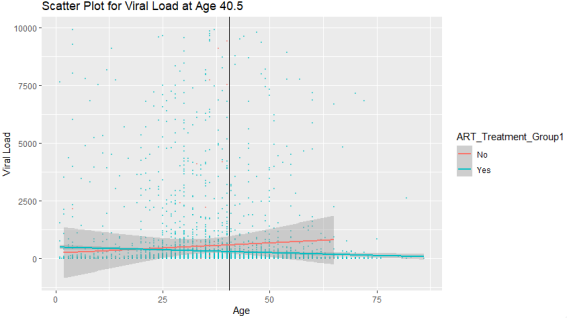
Figure 4. Manipulation Test Graph for Age.
3.5. Treatment Effect for the Running Variables
3.5.1. Treatment Effect for CD4 Count
A polynomial of order 3 was used in the analysis. Table 1 below shows the treatment effects, their z-values and p-values for the simulated data and the Quality-of-Care dataset with CD4 count as the running variable. The treatment effect was increasingly negative as the cutoff points increased, which indicated an improved viral load suppression among patients who adhered to the ART treatment for the simulated as well as the Quality-of-Care dataset. The both datasets indicated that there was a varying statistical significance per threshold.
Table 1. Treatment effect with CD4 as the running variable.

Cutoff point

Simulated Dataset

Quality-of-Care Dataset

Estimate

Z Value

P value

Estimate

Z Value

P value

250

-53.90

-1.205

0.2281

-66.18

-1.35

0.178

300

-63.48

-1.38

0.167

-80.53

-2.37

0.02*

320

-86.11

-1.44

0.807

-106.71

-2.19

0.03*

400

-127.86

-2.374

0.017*

-155.29

-0.89

0.37

450

-138.08

-2.595

0.289

-167.48

-1.14

0.25

500

-164.88

-2.67

0.174

-177.69

-2.41

0.02*

3.5.2. Treatment Effect for Age as the Running Variable
There was an increasing negative causal effect of ART treatment on viral load suppression as the patients’ ages increased. The treatment effect of ART on viral load suppression does not show significant trends with increasing age cutoffs. However, the Quality-of-Care dataset shows a significant negative effect at age cutoff 15, with other age cutoffs showing non-significant effects.
Table 2. Treatment effect with age as the running variable. Treatment effect with age as the running variable. Treatment effect with age as the running variable.

Cutoff point

Simulated Dataset

Quality-of-Care Dataset

Estimate

Z Value

P value

Estimate

Z Value

P value

15

-0.5587

-0.406

0.685

-117.3

-2.505

0.01*

19

-0.333

-0.214

0.831

-119.95

-0.964

0.335

24

-0.643

-0.318

0.751

-124.41

-1.234

0.217

32

-3.108

-0.827

0.408

-127.72

-0.107

0.914

35

-5.148

-0.997

0.319

-131.31

-1.56

0.117

40.5

-5.191

-0.36

0.717

--131.75

-1.708

0.088

3.6. Bandwidth Analysis
3.6.1. Bandwidth Based on CD4 Count as the Running Variable
Bandwidths for the simulated dataset range from 135.74 to 387.34, with varying numbers of observations on the left and the right-hand side at each cutoff point. The Quality-of-Care dataset shows similar trends but with larger bandwidths and observation counts. The bandwidth was large for larger cutoff points.
Table 3. Bandwidth Analysis for CD4 count

Cutoff point

Simulated Dataset

Quality-of-Care Dataset

Bandwidth

Observations on the left

Bandwidth

Observations on the left

250

285.6

1505

238.82

2330

300

236.9

1714

496.78

2955

320

355.734

1988

500.47

3153

400

193.67

1267

312.14

3123

450

387.34

2568

392.84

3689

500

135.74

655

375.19

3398

3.6.2. Bandwidth Based on Age as the Running Variable
The bandwidths for age range from 3.57 to 35.908 in the simulated dataset, with corresponding numbers of observations on the left of each cutoff. The Quality-of-Care dataset shows similar bandwidths but with more data points and a wider range. The bandwidths for age were relatively small and consistent, reflecting a focused analysis around age cutoffs. The bandwidths for the Quality-of-Care dataset were larger compared to the simulated dataset, especially in higher cutoffs.
3.7. McCrary Test
The McCrary test results indicate varying levels of discontinuity at different cutoffs for CD4 counts and age. There were irregularities around the cutoff points for the cutoff points 450 and 500 in the Quality-of-Care dataset. The simulated dataset showed little evidence of discontinuities in the datasets. For the age cutoffs, the McCrary test results indicate very significant discontinuities in both datasets, especially for younger age cutoffs. This suggests potential manipulation or irregularities around these age cutoffs.
Table 4. Bandwidth Analysis for Age count.

Cutoff point

Simulated Dataset

Quality-of-Care Dataset

Bandwidth

Observations on the left

Bandwidth

Observations on the left

15

3.57

105

12.48

222

19

3.66

203

14.40

248

24

3.816

367

18.201

532

32

3.952

607

21.94

1757

35

3.68

581

35.908

2449

40.5

3.60

664

17.97

3421

Table 5. Mc Crary Density Test Results.

Cutoff point for CD4 Count

Mcrary Test for Simulated Data

McCary test for the Quality-of-Care dataset

Cutoff point for age

Mcrary Test for Simulated Data

McCary test for the Quality-of-Care dataset

250

0.986

0.4017

15

0.00012

-

300

0.622

0.7856

19

<0.0000

<0.000

320

0.388

0.6206

24

<0.0000

<0.000

400

0.544

0.2545

32

<0.0000

<0.000

450

0.185

0.0009

35

<0.0000

<0.000

500

0.696

0.02

40.5

<0.0000

<0.000

3.8. Compliance Ratios
The compliance ratios were generally high which implied good adherence to treatment around the cutoffs. For CD4 counts, compliance ranges from 50% to 66.67%, while for age, it ranges from 94.59% to 100%. The compliance rates did not differ for two types of datasets based on the selected running variable. Generally, there was a lower compliance rate for the Quality-of-Care dataset compared to the simulated dataset. The compliance ratios were higher for the age variable than for CD4 count.
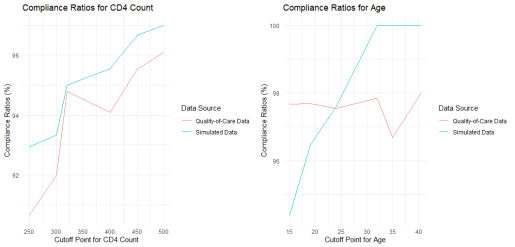
Figure 5. Compliance Ratios
4. Discussion
There were identical findings in the analysis of the Quality-of-Care dataset and the simulated data. When using CD4 count as the running variable, the treatment effect became increasingly negative with increasing cutoff points. This implies that patients adhering to ART exhibit more substantial viral load suppression as their CD4 count increases. When using age as the running variable, the treatment effect of ART on viral load suppression becomes more negative with increasing age. This suggests that ART is increasingly beneficial for older patients in terms of viral load suppression.
The McCrary test for discontinuity, bandwidth analysis and manipulation test were used to explore the assumptions of the model. The study indicated that there was a difference in the precision and robustness of the treatment effect estimates at different cutoff points. There was a significant variation in the bandwidths across the cutoffs for CD4 count and age. Larger bandwidths were observed at cutoffs with more observations, allowing for a more comprehensive analysis but potentially including less relevant data. The McCrary test indicated significant discontinuities for cutoffs 450 and 500 in the Quality-of-Care dataset, suggesting potential manipulations of CD4 count at these points. There were significant discontinuities in all the age cutoffs used in the analysis.
High compliance ratios for both running variables in the simulated dataset indicated a generally good adherence to ART among various cutoff points. The compliance ratio generally increases with higher CD4 count thresholds, suggesting that individuals with higher CD4 counts are more likely to comply with treatment assignments. The interventions were effectively accepted at higher CD4 thresholds. The Quality-of-Care dataset indicates perfect compliance for respondents whose CD4 counts exceeded 400, which implies that patients with higher CD4 counts most probably adhered to the HIV prescriptions fully. There was a jump in the compliance rates based on age for the simulated dataset, but a perfectly high and consistent compliance based on age thresholds for the Quality-of-Care dataset.
The findings from the Quality-of-Care dataset indicate that an increasing cutoff point for the CD4 count was associated with a decline in the people on the left side of the discontinuity. This implied that there was a larger number of patients recruited into the ART programs as the CD4 count measures increased. These findings were in accordance with . A similar trend was observed as the cutoff for ages decreased. The overall definition of youths considered in the current study was individuals aged between 15 and 35. ART treatment is optimal for patients at 40.5 years, which implies that governments and health bodies should optimize ART treatment for older adults to reduce their risk of mortality associated with contracting HIV/AIDS . At the same time, the study matches the findings that immediate ART initiation as CD4 counts increase is necessary in reducing mortality risks and progression to AIDS .
5. Conclusions
This study aimed at modeling viral load suppression using the non-parametric fuzzy regression discontinuity design. The study investigated the causal effects of ART treatment on viral load suppression of patients based on age and CD4-Count cutoffs. The study objectives were to formulate a non-parametric fuzzy RDD for viral load suppression among PLWHA, to evaluate model performance through simulation, and to apply fuzzy RDD to a dataset, which in this case, was the quality-of-care dataset from Kaggle.
The analysis of the data indicated that the optimal cutoff points for age and CD4 count were 40.5 years and 320 cells/cubic millimeters. The findings indicate an increase in compliance to ART treatment as CD4 count increases and as age approaches 40.5 years.
The study also indicated the suitability of the model ascertained by the high compliance ratios and meeting of the model assumptions. Viral load suppression for compliers undergoing ART is achieved as their CD4 counts and ages increase. This could result from the adherence to the treatment and improvement of the immune systems with this adherence.
Some of the limitations of the current study include non-parametric complexity. As shown in the bandwidth analysis, there is an indication of overfitting and a mis-specified trend. The study fails to address the causal effects across the full distribution of viral loads, which prevents the generalization of the results beyond the specified cutoff points. Further research into the causal effects for a joint cutoff (multi cutoff) should be carried out to investigate the response to treatment effects based on combined cutoffs.
Abbreviations

AIDS

Acquired Immunodeficiency Syndrome

ART

Antiretroviral Therapy

CD4

Count Cluster of Differentiation 4 Count

FRDD

Fuzzy Regression Discontinuity Design

HIV

Human Immunodeficiency Virus

LATE

Local Average Treatment Effect

PLWHA

People Living with HIV or AIDS

Author Contributions
Caroline Miano: Conceptualization, Data curation, Formal Analysis, Methodology, Software, Visualization, Writing – original draft, Writing – review & editing
Samuel Mwalili: Conceptualization, Data curation, Formal Analysis, Investigation, Methodology, Project administration, Resources, Software, Supervision, Validation, Visualization
Bonface Malenje: Conceptualization, Data curation, Formal Analysis, Funding acquisition, Investigation, Methodology, Project administration, Resources, Software, Supervision, Validation, Visualization
Funding
This work is not supported by any external funding.
Data Availability Statement
The data used in the study can be found at https://www.kaggle.com/datasets/iogbonna/quality-of-care-dataset-for-hiv-clients.
Conflicts of Interest
The authors declare no conflicts of interest.
Appendix
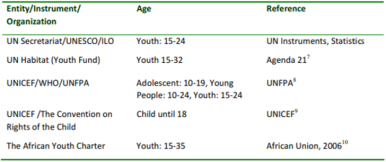
Figure 6. Definitions of Youths by Various entities.
References
[1] Nguyen, M. A Guide on Data Analysis. Bookdown. 2020.
[2] Gelman, A., Imbens, G. Why high-order polynomials should not be used in regression discontinuity designs. Journal of Business & Economic Statistics. 2019, 37(3), 447-456.
[3] Dong, F., Zhang, Y., Zhou, Y. Fuzzy regression discontinuity design for causal effect of HIV treatment on viral suppression: A study of China. International Journal of Environmental Research and Public Health. 2021, 18(3), 1072.
[4] Zhang, S., Chen, X., Leng, R. Fuzzy regression discontinuity design in the evaluation of HIV/AIDS intervention. Journal of Biomedical Research. 2019, 33(2), 80-84.
[5] He, Y., Bartalotti, O. Wild bootstrap for fuzzy regression discontinuity designs: obtaining robust bias-corrected confidence intervals. The Econometrics Journal. 2020, 23(2), 211-231.
[6] Mafukidze, P. K., Mwalili, S. M., Mageto, T. A Modification to the Fuzzy Regression Discontinuity Model to Settings with Fuzzy Variables. Open Journal of Statistics. 2022, 12(5), 676-690.
[7] Tymejczyk, O., Brazier, E., Yiannoutsos, C. T., Vinikoor, M., van Lettow, M., Nalugoda, F., IeDEA consortium. Changes in rapid HIV treatment initiation after national “treat all” policy adoption in 6 sub-Saharan African countries: regression discontinuity analysis. PLoS medicine, 2019, 16(6), e1002822.
[8] Sibanda, K., Gundu, T., Whata, A. Assessing the Credibility of South Africa's Anti-Retroviral Treatment (ART) Eligibility Guidelines using Regression Discontinuity Designs. In 2020 2nd International Multidisciplinary Information Technology and Engineering Conference (IMITEC). 2020, 1-5. IEEE.
[9] Chib, S., Greenberg, E., Simoni, A. (2014). Nonparametric bayes analysis of the sharp and fuzzy regression discontinuity designs. Econometric Theory. 2014, 1-53.
[10] Pei, Z., Lee, D. S., Card, D., & Weber, A. Local polynomial order in regression discontinuity designs. Journal of Business & Economic Statistics. 2022, 40(3), 1259-1267.
[11] Malaza, A., Mossong, J., Bärnighausen, T., Viljoen, J., Newell, M. L. Population-based CD4 counts in a rural area in South Africa with high HIV prevalence and high antiretroviral treatment coverage. PloS one. 2013, 8(7), e70126.
[12] Yana, Cahyana., Tukino. Prediction Model for Covid-19 Cases in Indonesia Using Linear Regression and Polynomial Regression Methods. 2023,
[13] Ssebutinde, P., Kyamwanga, I. T., Turyakira, E., Asiimwe, S., & Bajunirwe, F. (2018). Effect of age at initiation of antiretroviral therapy on treatment outcomes; A retrospective cohort study at a large HIV clinic in southwestern Uganda. PLoS One, 13(8), e0201898.
[14] Song, A., Liu, X., Huang, X., Meyers, K., Oh, D. Y., Hou, J., Wu, H. From CD4-based initiation to treating all HIV-infected adults immediately: an evidence-based meta-analysis. Frontiers in immunology. 2023, 9, 212.
Cite This Article
  • APA Style

    Miano, C., Mwalili, S., Malenje, B. (2024). Non-Parametric Fuzzy Regression Discontinuity Design in Modelling Viral Load Suppression Among People Living With HIV/AIDS (PLWHA). American Journal of Theoretical and Applied Statistics, 13(5), 115-126. https://doi.org/10.11648/j.ajtas.20241305.12

    Copy | Download

    ACS Style

    Miano, C.; Mwalili, S.; Malenje, B. Non-Parametric Fuzzy Regression Discontinuity Design in Modelling Viral Load Suppression Among People Living With HIV/AIDS (PLWHA). Am. J. Theor. Appl. Stat. 2024, 13(5), 115-126. doi: 10.11648/j.ajtas.20241305.12

    Copy | Download

    AMA Style

    Miano C, Mwalili S, Malenje B. Non-Parametric Fuzzy Regression Discontinuity Design in Modelling Viral Load Suppression Among People Living With HIV/AIDS (PLWHA). Am J Theor Appl Stat. 2024;13(5):115-126. doi: 10.11648/j.ajtas.20241305.12

    Copy | Download

  • @article{10.11648/j.ajtas.20241305.12,
      author = {Caroline Miano and Samuel Mwalili and Bonface Malenje},
      title = {Non-Parametric Fuzzy Regression Discontinuity Design in Modelling Viral Load Suppression Among People Living With HIV/AIDS (PLWHA)
    },
      journal = {American Journal of Theoretical and Applied Statistics},
      volume = {13},
      number = {5},
      pages = {115-126},
      doi = {10.11648/j.ajtas.20241305.12},
      url = {https://doi.org/10.11648/j.ajtas.20241305.12},
      eprint = {https://article.sciencepublishinggroup.com/pdf/10.11648.j.ajtas.20241305.12},
      abstract = {Adherence to antiretroviral therapy (ART) is a significant determinant of viral load suppression in HIV patients. There are inadequate statistical models that bring out the direct effects of ART on the suppression of HIV/AIDS. Traditional regression models address the general determinants of viral load suppression. Regression discontinuity designs, on the other hand, bring out the causal effects of ART on viral load suppression based on various thresholds. This study used the non-parametric fuzzy regression discontinuity design (FRDD) to model viral load suppression in PLWHA. The study began with developing a non-parametric FRDD, simulating the model to assess its performance, and applying the model to the Quality-of-Care dataset from Kaggle. The study focused on viral load suppression as the outcome variable, CD4 count and age as the running variables, gender, and whether a patient received counseling as additional covariates. The optimal thresholds were 40.5 years and 320 cubic millimeters for the CD4. There was an increasing negative treatment effect of ART on viral load suppression as the cutoff points for CD4 count increase. At the same time, there was an increasing negative treatment effect of ART on viral load suppression with increasing age. The compliance ratios for respondents increased with the negative increase in the treatment effect. Other analyses, such as the McCrary density test, bunching test, and manipulation test, indicated that the non-parametric fuzzy regression discontinuity design is effective in modeling viral load suppression.
    },
     year = {2024}
    }
    

    Copy | Download

  • TY  - JOUR
    T1  - Non-Parametric Fuzzy Regression Discontinuity Design in Modelling Viral Load Suppression Among People Living With HIV/AIDS (PLWHA)
    
    AU  - Caroline Miano
    AU  - Samuel Mwalili
    AU  - Bonface Malenje
    Y1  - 2024/10/10
    PY  - 2024
    N1  - https://doi.org/10.11648/j.ajtas.20241305.12
    DO  - 10.11648/j.ajtas.20241305.12
    T2  - American Journal of Theoretical and Applied Statistics
    JF  - American Journal of Theoretical and Applied Statistics
    JO  - American Journal of Theoretical and Applied Statistics
    SP  - 115
    EP  - 126
    PB  - Science Publishing Group
    SN  - 2326-9006
    UR  - https://doi.org/10.11648/j.ajtas.20241305.12
    AB  - Adherence to antiretroviral therapy (ART) is a significant determinant of viral load suppression in HIV patients. There are inadequate statistical models that bring out the direct effects of ART on the suppression of HIV/AIDS. Traditional regression models address the general determinants of viral load suppression. Regression discontinuity designs, on the other hand, bring out the causal effects of ART on viral load suppression based on various thresholds. This study used the non-parametric fuzzy regression discontinuity design (FRDD) to model viral load suppression in PLWHA. The study began with developing a non-parametric FRDD, simulating the model to assess its performance, and applying the model to the Quality-of-Care dataset from Kaggle. The study focused on viral load suppression as the outcome variable, CD4 count and age as the running variables, gender, and whether a patient received counseling as additional covariates. The optimal thresholds were 40.5 years and 320 cubic millimeters for the CD4. There was an increasing negative treatment effect of ART on viral load suppression as the cutoff points for CD4 count increase. At the same time, there was an increasing negative treatment effect of ART on viral load suppression with increasing age. The compliance ratios for respondents increased with the negative increase in the treatment effect. Other analyses, such as the McCrary density test, bunching test, and manipulation test, indicated that the non-parametric fuzzy regression discontinuity design is effective in modeling viral load suppression.
    
    VL  - 13
    IS  - 5
    ER  - 

    Copy | Download

Author Information
  • Abstract
  • Keywords
  • Document Sections

    1. 1. Introduction
    2. 2. Materials and Methods
    3. 3. Results
    4. 4. Discussion
    5. 5. Conclusions
    Show Full Outline
  • Abbreviations
  • Author Contributions
  • Funding
  • Data Availability Statement
  • Conflicts of Interest
  • Appendix
  • References
  • Cite This Article
  • Author Information