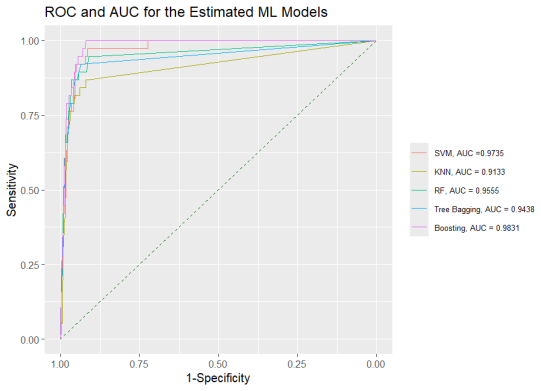
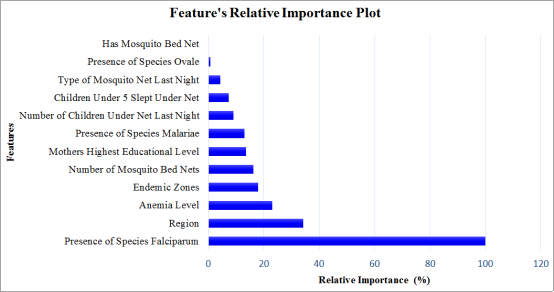
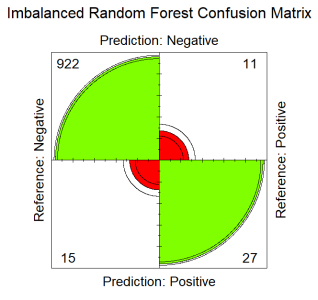
For many years’ malaria has been a health public concern in Kenya as well as many parts of Africa and other parts of the world. The purpose of this study is to develop and evaluate a supervised machine learning model to predict malaria occurrence (final malaria test results) in Kenya. The study investigated twelve predictor variables on the outcome variable (malaria test results), where five machine learning models namely; k-nearest neighbors, support vector machines, random forest, tree bagging, and boosting, were estimated. During the model evaluation, random forest emerged as the best overall model in the classification and prediction of final malaria test results. The model attained a higher classification accuracy of 97.33%, sensitivity of 71.1%, specificity of 98.4%, balanced accuracy of 84.7% and an area under the curve of 98.3%. From the final model, the presence of plasmodium falciparum emerged most important feature, followed by region, endemic zone and anemic level. The feature with the least importance in predicting final malaria test results was having mosquito nets. In conclusion, employing Machine learning algorithms enhances early detection, optimizing resource allocation for interventions, and ultimately reducing the incidence and impact of malaria in the Kenya. The study recommends allocation of resources and funds to areas with the presence of plasmodium falciparum, region susceptible to malaria, endemic zones and anemic prone areas.
| Published in | American Journal of Theoretical and Applied Statistics (Volume 13, Issue 4) |
| DOI | 10.11648/j.ajtas.20241304.11 |
| Page(s) | 65-72 |
| Creative Commons |
This is an Open Access article, distributed under the terms of the Creative Commons Attribution 4.0 International License (http://creativecommons.org/licenses/by/4.0/), which permits unrestricted use, distribution and reproduction in any medium or format, provided the original work is properly cited. |
| Copyright |
Copyright © The Author(s), 2024. Published by Science Publishing Group |
Machine Learning, Accuracy, Sensitivity, Specificity, Feature, Balance Accuracy, Malaria
Malaria Test Results | N = 3,280 |
|---|---|
Negative | 3149 (96%) |
Positive | 131(4%) |
Characteristic | Negative, N = 3,1491 | 95% CI2 | Positive, N = 1311 | 95% CI2 | p-value3 |
|---|---|---|---|---|---|
Endemic Zones | |||||
Highland Epidemic | 540 (17%) | 16%, 19% | 4 (3.1%) | 0.98%, 8.1% | <0.001 |
Lake Endemic | 1,088 (35%) | 33%, 36% | 107 (82%) | 74%, 88% | |
Coastal Endemic | 353 (11%) | 10%, 12% | 14 (11%) | 6.2%, 18% | |
Seasonal | 743 (24%) | 22%, 25% | 6 (4.6%) | 1.9%, 10% | |
Low Risk | 425 (13%) | 12%, 15% | 0 (0%) | 0.00%, 3.6% | |
Number of Children Slept Under Net Last Night | |||||
None | 1,202 (38%) | 36%, 40% | 40 (31%) | 23%, 39% | 0.008 |
One | 1,269 (40%) | 39%, 42% | 70 (53%) | 45%, 62% | |
Two | 585 (19%) | 17%, 20% | 17 (13%) | 8.0%, 20% | |
Three | 82 (2.6%) | 2.1%, 3.2% | 2 (1.5%) | 0.26%, 6.0% | |
Four | 11 (0.3%) | 0.18%, 0.64% | 2 (1.5%) | 0.26%, 6.0% | |
Anemia Level | |||||
Severe | 69 (2.2%) | 1.7%, 2.8% | 8 (6.1%) | 2.9%, 12% | <0.001 |
Moderate | 774 (25%) | 23%, 26% | 66 (50%) | 42%, 59% | |
Mild | 749 (24%) | 22%, 25% | 32 (24%) | 18%, 33% | |
Not anemic | 1,557 (49%) | 48%, 51% | 25 (19%) | 13%, 27% | |
Mother's Highest Educational Level | |||||
No education | 525 (17%) | 15%, 18% | 10 (7.6%) | 3.9%, 14% | <0.001 |
Primary | 1,428 (45%) | 44%, 47% | 89 (68%) | 59%, 76% | |
Secondary | 866 (28%) | 26%, 29% | 26 (20%) | 14%, 28% | |
Higher | 330 (10%) | 9.4%, 12% | 6 (4.6%) | 1.9%, 10% | |
Performance Metrics | Support Vector Machines | K Nearest Neighbors | Random Forest | Tree Bagging | Boosting |
|---|---|---|---|---|---|
Sensitivity | 0.447 | 0.053 | 0.711 | 0.711 | 0.605 |
Specificity | 0.985 | 0.999 | 0.984 | 0.974 | 0.987 |
Precision | 0.548 | 0.667 | 0.643 | 0.529 | 0.657 |
F1-Score | 0.493 | 0.098 | 0.675 | 0.607 | 0.63 |
Balanced Accuracy | 0.716 | 0.526 | 0.847 | 0.842 | 0.796 |
AUC | Area Under the Curve |
ROC | Receiver Operating Characteristic |
KNBS | Kenya National Bureau of Statistics |
SVM | Support Vector Machine |
RF | Random Forest |
KNN | Kernel Nearest Neighbors |
ML | Machine Learning |
| [1] | Capili, B. (2021). Cross-Sectional Studies. The American Journal of Nursing/American Journal of Nursing, 121(10), 59–62. |
| [2] | Chapelle, O. (2007). Training a Support Vector Machine in the Primal. Neural Computation, 19(5), 1155–1178. |
| [3] | Adeyemo, A. O., Aborode, A. T., Bello, M. A., Obianuju, A. F., Hasan, M. M., Kehinde, D. O., Hossain, M. S., Bardhan, M., Imisioluwa, J. O., & Akintola, A. A. (2022). Malaria vaccine: The lasting solution to malaria burden in Africa. Annals of Medicine and Surgery, 79, 104031. |
| [4] | Agapaki, E., & Nahangi, M. (2020). Scene understanding and model generation. Elsevier EBooks, 65–167. |
| [5] | Al-Obaidi, K. M., Ismail, M., & Malek, A. (2014). A study of the impact of environmental loads that penetrate a passive skylight roofing system in Malaysian buildings. Frontiers of Architectural Research, 3(2), 178–191. |
| [6] | Galal, A., Marwa Talal, & Moustafa, A. A. (2022). Applications of machine learning in metabolomics: Disease modeling and classification. Frontiers in Genetics, 13. |
| [7] | Giesen, C., Roche, J., Redondo-Bravo, L., Ruiz-Huerta, C., Gomez-Barroso, D., Benito, A., & Herrador, Z. (2020). The impact of climate change on mosquito-borne diseases in Africa. Pathogens and Global Health, 114(6), 1–15. |
| [8] | Ileperuma, K., Jampani, M., Sellahewa, U., Panjwani, S., & Amarnath, G. (2023). Predicting Malaria Prevalence with Machine Learning Models Using December 2023 Colombo, Sri Lanka. |
| [9] | Lee, Y. W., Choi, J. W., & Shin, E.-H. (2021). The machine learning model for predicting malaria using clinical information. Computers in Biology and Medicine, 129, 104151. |
| [10] | Oladipo, H. J., Tajudeen, Y. A., Oladunjoye, I. O., Yusuff, S. I., Yusuf, R. O., Oluwaseyi, E. M., AbdulBasit, M. O., Adebisi, Y. A., & El-Sherbini, M. S. (2022). Increasing challenges of malaria control in sub-Saharan Africa: Priorities for public health research and policymakers. Annals of Medicine and Surgery, 81(104366). |
| [11] | Popkin, Z. R., Seth, M. D., Madebe, R. A., Rule Budodo, Bakari, C., Francis, F., Dativa Pereus, Giesbrecht, D. J., Mandara, C. I., Mbwambo, D., Aaron, S., Abdallah Lusasi, Lazaro, S., Bailey, J. A., Juliano, J. J., Gutman, J. R., & Ishengoma, D. S. (2023). Malaria species prevalence among asymptomatic individuals in four regions of Mainland Tanzania. MedRxiv (Cold Spring Harbor Laboratory). |
| [12] | Sato, S. (2021). Plasmodium—a Brief Introduction to the Parasites Causing Human Malaria and Their Basic Biology. Journal of Physiological Anthropology, 40(1). |
| [13] | Stavropoulos, G., Voorstenbosch, R. van, Schooten, F.-J. van, & Smolinska, A. (2020). Random Forest and Ensemble Methods. Elsevier EBooks, 661–672. |
| [14] | Takken, W. (2021). The mosquito and malaria. Routledge EBooks, 109–122. |
| [15] | Trampuz, A., Jereb, M., Muzlovic, I., & Prabhu, R. M. (2003). Clinical review: Severe Malaria. Critical Care, 7(4), 315. |
| [16] | WHO. (2024). Malaria. WHO | Regional Office for Africa. |
| [17] |
Cunningham, P., & Delany, S. J. (2007, April 27). k-Nearest neighbor classifiers. ResearchGate; Association for Computing Machinery.
https://www.researchgate.net/publication/228686398_k-Nearest_neighbour_classifiers |
| [18] | Kazeem, I., & Adebanji, S. (2021, November 22). A model for predicting malaria outbreak using machine learning technique. ResearchGate; Scientific Annals of Computer Science. |
| [19] | World. (2023, December 4). Malaria. Who.int; World Health Organization: WHO. |
| [20] | Owoko, L. (2024, June 11). Kenya’s child malaria deaths fall three-fold on campaigns. Business Daily; Business Daily. |
APA Style
Muriithi, D., Lumumba, V. W., Okongo, M. (2024). A Machine Learning-Based Prediction of Malaria Occurrence in Kenya. American Journal of Theoretical and Applied Statistics, 13(4), 65-72. https://doi.org/10.11648/j.ajtas.20241304.11
ACS Style
Muriithi, D.; Lumumba, V. W.; Okongo, M. A Machine Learning-Based Prediction of Malaria Occurrence in Kenya. Am. J. Theor. Appl. Stat. 2024, 13(4), 65-72. doi: 10.11648/j.ajtas.20241304.11
AMA Style
Muriithi D, Lumumba VW, Okongo M. A Machine Learning-Based Prediction of Malaria Occurrence in Kenya. Am J Theor Appl Stat. 2024;13(4):65-72. doi: 10.11648/j.ajtas.20241304.11
@article{10.11648/j.ajtas.20241304.11,
  author = {Dennis Muriithi and Victor Wandera Lumumba and Mark Okongo},
  title = {A Machine Learning-Based Prediction of Malaria Occurrence in Kenya
},
  journal = {American Journal of Theoretical and Applied Statistics},
  volume = {13},
  number = {4},
  pages = {65-72},
  doi = {10.11648/j.ajtas.20241304.11},
  url = {https://doi.org/10.11648/j.ajtas.20241304.11},
  eprint = {https://article.sciencepublishinggroup.com/pdf/10.11648.j.ajtas.20241304.11},
  abstract = {For many years’ malaria has been a health public concern in Kenya as well as many parts of Africa and other parts of the world. The purpose of this study is to develop and evaluate a supervised machine learning model to predict malaria occurrence (final malaria test results) in Kenya. The study investigated twelve predictor variables on the outcome variable (malaria test results), where five machine learning models namely; k-nearest neighbors, support vector machines, random forest, tree bagging, and boosting, were estimated. During the model evaluation, random forest emerged as the best overall model in the classification and prediction of final malaria test results. The model attained a higher classification accuracy of 97.33%, sensitivity of 71.1%, specificity of 98.4%, balanced accuracy of 84.7% and an area under the curve of 98.3%. From the final model, the presence of plasmodium falciparum emerged most important feature, followed by region, endemic zone and anemic level. The feature with the least importance in predicting final malaria test results was having mosquito nets. In conclusion, employing Machine learning algorithms enhances early detection, optimizing resource allocation for interventions, and ultimately reducing the incidence and impact of malaria in the Kenya. The study recommends allocation of resources and funds to areas with the presence of plasmodium falciparum, region susceptible to malaria, endemic zones and anemic prone areas.
},
 year = {2024}
}
TY  - JOUR
T1  - A Machine Learning-Based Prediction of Malaria Occurrence in Kenya

AU  - Dennis Muriithi
AU  - Victor Wandera Lumumba
AU  - Mark Okongo
Y1  - 2024/08/20
PY  - 2024
N1  - https://doi.org/10.11648/j.ajtas.20241304.11
DO  - 10.11648/j.ajtas.20241304.11
T2  - American Journal of Theoretical and Applied Statistics
JF  - American Journal of Theoretical and Applied Statistics
JO  - American Journal of Theoretical and Applied Statistics
SP  - 65
EP  - 72
PB  - Science Publishing Group
SN  - 2326-9006
UR  - https://doi.org/10.11648/j.ajtas.20241304.11
AB  - For many years’ malaria has been a health public concern in Kenya as well as many parts of Africa and other parts of the world. The purpose of this study is to develop and evaluate a supervised machine learning model to predict malaria occurrence (final malaria test results) in Kenya. The study investigated twelve predictor variables on the outcome variable (malaria test results), where five machine learning models namely; k-nearest neighbors, support vector machines, random forest, tree bagging, and boosting, were estimated. During the model evaluation, random forest emerged as the best overall model in the classification and prediction of final malaria test results. The model attained a higher classification accuracy of 97.33%, sensitivity of 71.1%, specificity of 98.4%, balanced accuracy of 84.7% and an area under the curve of 98.3%. From the final model, the presence of plasmodium falciparum emerged most important feature, followed by region, endemic zone and anemic level. The feature with the least importance in predicting final malaria test results was having mosquito nets. In conclusion, employing Machine learning algorithms enhances early detection, optimizing resource allocation for interventions, and ultimately reducing the incidence and impact of malaria in the Kenya. The study recommends allocation of resources and funds to areas with the presence of plasmodium falciparum, region susceptible to malaria, endemic zones and anemic prone areas.

VL  - 13
IS  - 4
ER  -
Center for Data Analytics and Modelling, Faculty of Science and Technology, Chuka University, Chuka, Kenya
Center for Data Analytics and Modelling, Faculty of Science and Technology, Chuka University, Chuka, Kenya
Center for Data Analytics and Modelling, Faculty of Science and Technology, Chuka University, Chuka, Kenya
Information